The function 'Chart' is the data visualization as graphical display using curves. It is divided in static Charts and Live Charts.
Menu Section
Views
Hierarchy level
static Chart : Sub element of a Dataset
live Chart : Sub element of a Channel
Procedure 'static Chart'
A static View is created once for a specific dataset and will not change their values afterward. (Only the graphical appearance can still be adjusted afterward by the User.)
| • | Select a dataset in the Project Explorer (shall be highlighted) |
| • | Select 'Chart' in the Menu 'Project' 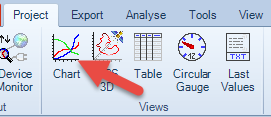 |
| • | The static Chart will be created as a sub-element of the dataset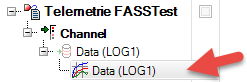 |
Procedure 'live Chart'
A Live Chart always show the latest received (and stored) data of one Channel of a specific device. The graphical display update can be configured using 'Interval (ms)' and 'X Value Count'.
| • | Einen Channel im Project anklicken |
| • | Select a Channel in the Project Explorer (shall be highlighted) |
| • | The live Chart entry will be created as a sub-element of the Channel.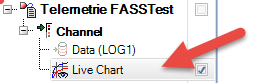 |
| • | Live Views must be activated (start and stop function) by the User with the checkbox on the right hand side of the Live View entry in the Project Explorer. |
Note
The quantity of charts (static or live) within LogView Studio is unlimited. It is also possible to create more than one chart for a specific dataset.
Additional Information
Working with LogView Studio - Chart - Graphic Layout